Conventional risk models built on assumptions of gradual, linear climate change are becoming obsolete; they fail to account for self-amplifying feedback loops that trigger abrupt, non-linear state shifts in Earth’s systems.
- Positive feedback loops, like the ice-albedo effect and permafrost thaw, don’t just add to warming—they multiply it, creating systemic fragility.
- Ecosystems such as the Amazon rainforest are approaching critical thresholds, or “tipping points,” where they can flip from being carbon sinks to net carbon sources with little warning.
Recommendation: Long-term investors and insurers must shift from attempting to predict precise outcomes to assessing systemic fragility and modeling the risk of sudden, cascading changes.
For decades, long-term investors and insurers have relied on sophisticated models to price future risk. These models, built on historical data and projected trends, have one fundamental, often unspoken, assumption: that change, even when rapid, is largely linear and predictable. We project future sea levels, temperature rises, and storm frequencies along a relatively smooth curve. The common wisdom suggests we can manage this by adapting along the slope of change. But what if the climate system doesn’t operate on slopes? What if it operates on cliffs?
The critical flaw in our current risk assessment paradigm is its failure to adequately integrate the concept of positive feedback loops—self-perpetuating cycles that amplify initial changes. These are not minor variables; they are systemic accelerators that can push regional and global systems toward abrupt, dramatic, and often irreversible “state shifts.” Understanding these loops is no longer an academic exercise. For anyone attempting to model risk over a multi-decade horizon, it is the most crucial variable, revealing that the true danger is not the predictable slope of warming, but the unpredictable timing of the cliff edge.
This analysis moves beyond a simple catalog of environmental problems. It deconstructs the mechanics of these feedback loops to explain *why* they make our predictions so unreliable. We will explore how these non-linear dynamics function across different systems—from water vapor and forests to soil and ice—to build a new framework for thinking about risk in an increasingly unstable world.
To fully grasp the systemic nature of this challenge, the following sections deconstruct the key feedback mechanisms that defy linear modeling. This exploration will provide a structured understanding of the non-linear risks facing our planet’s core systems.
Summary: How Positive Feedback Loops Make Climate Predictions Unreliable?
- Why Is Water Vapor the Strongest Greenhouse Gas But Not a Driver?
- How to Identify When a Rainforest Becomes a Net Carbon Source?
- Dry Soil vs Wet Soil: Which Amplifies Heatwaves More Intensely?
- The Modeling Mistake of Assuming Climate Change Will Remain Gradual
- How to Intervene in Local Feedback Loops to Prevent Desertification?
- Why Does White Ice Reflect 80% of Sunlight While Dark Ocean Absorbs It?
- Why Does Melting Arctic Ice Accelerate Global Warming by 25%?
- How Systemic Disruption in Ocean Currents Changes Weather Patterns in Europe?
Why Is Water Vapor the Strongest Greenhouse Gas But Not a Driver?
Water vapor is, by a significant margin, the most abundant and potent greenhouse gas in our atmosphere. However, it functions as a powerful amplifier, not a primary driver, of climate change. This distinction is fundamental to understanding feedback loops. The amount of water vapor the atmosphere can hold is directly controlled by its temperature. For every one-degree Celsius of warming, the air’s capacity to hold water vapor increases by about 7%. This creates a classic positive feedback loop: initial warming (caused by CO2) leads to more water vapor, which in turn enhances the warming.
Studies indicate this feedback mechanism is so powerful that it effectively doubles the warming effect of the initial CO2 increase. Yet, it cannot initiate the change on its own. Unlike CO2, which can remain in the atmosphere for centuries, water vapor cycles out in about nine days. This short residency time means it responds to temperature but cannot set the long-term temperature trend itself. As Professor of Atmospheric Sciences Andrew Dessler explains, non-condensable gases like CO2 are the “control knobs” for the climate. Water vapor is the powerful amplifier that responds to the turning of those knobs.
For risk modelers, this is a critical insight into systemic fragility. The water vapor feedback isn’t a separate risk to be modeled; it is an embedded multiplier for all other warming risks. Any model that underestimates this amplification effect will fundamentally miscalculate the ultimate impact of CO2 emissions. It demonstrates how a stable component of the Earth system can become a source of instability once an external force is applied.
How to Identify When a Rainforest Becomes a Net Carbon Source?
A healthy rainforest, particularly the Amazon, acts as a planetary-scale carbon sink, absorbing vast amounts of CO2. However, this function is not guaranteed. A combination of deforestation, fire, and rising temperatures is pushing the system toward a critical tipping point, where it could flip into a net source of carbon. Identifying the proximity to this threshold is a major challenge for climate modeling. One key indicator is the forest’s loss of resilience—its ability to recover from stress like drought.
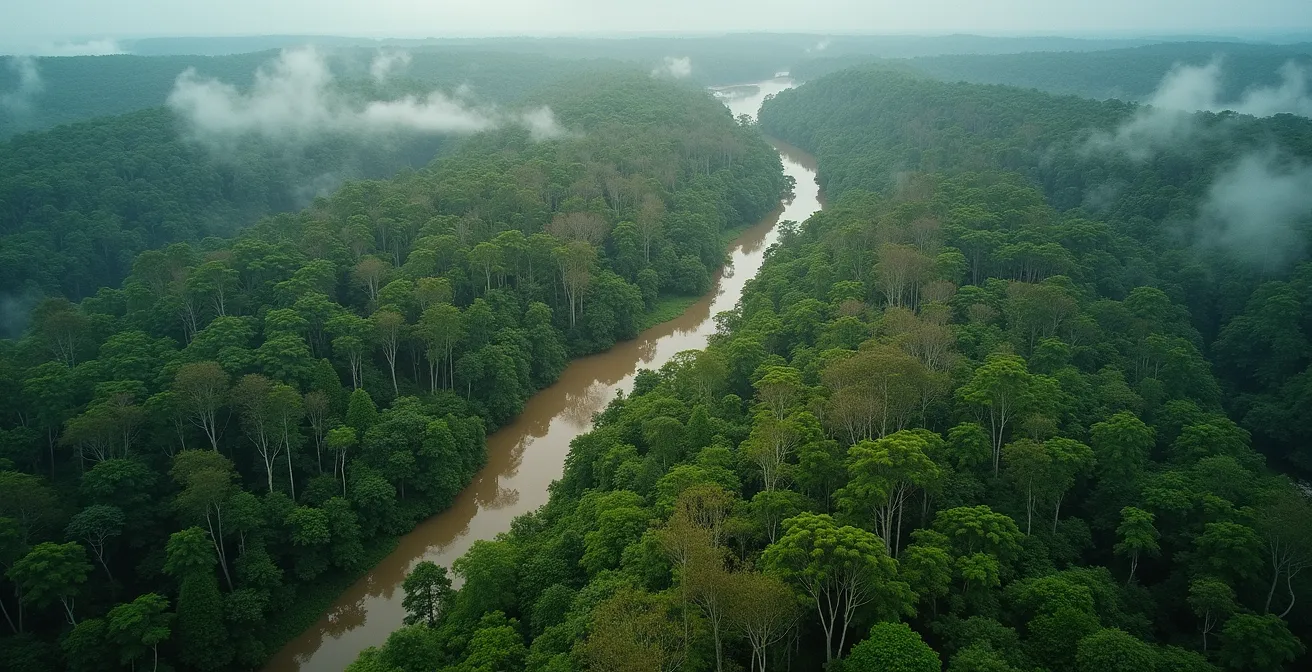
Recent research provides more concrete metrics. A 2024 study published in Nature found that parts of the Amazon are already emitting more CO2 than they absorb, particularly in the heavily deforested southeastern region. The study also identified a potential temperature threshold for large-scale dieback, suggesting that beyond a certain point, the forest’s ability to generate its own rainfall breaks down, triggering a self-reinforcing drying cycle. Scientists are now analyzing satellite data for changes in water content in trees and soil, and tracking the length of the dry season as early warning signals of this systemic state shift.
This transition from sink to source represents a terrifying non-linear event. A model assuming the Amazon remains a reliable carbon sink will be catastrophically wrong if the system crosses this threshold. The challenge lies in the fact that this is not a gradual decline but a potential cliff, where decades of stored carbon could be released relatively quickly, creating a massive, un-modeled pulse of warming. This demonstrates the profound danger of pushing complex systems past their point of resilience.
Dry Soil vs Wet Soil: Which Amplifies Heatwaves More Intensely?
Dry soil is a powerful and often overlooked amplifier of heatwaves. The difference in thermal response between wet and dry soil creates a potent local feedback loop that can dramatically intensify extreme heat events. When soil is moist, a significant portion of the sun’s energy is consumed by evaporation—a process known as latent heat flux. This process cools the surface and the air immediately above it, much like sweating cools the human body. It also releases moisture into the atmosphere, which can then form clouds that block sunlight and provide rain, further cooling the system.
In contrast, when soil is dry, this cooling mechanism is shut off. Incoming solar energy is no longer used for evaporation and is instead converted directly into sensible heat flux, which simply heats the ground and the air. This initiates a vicious cycle: hotter, drier conditions dry out the soil further, which in turn leads to even more intense heating. The lack of evaporation also means fewer clouds form, leading to more direct sun exposure and less rain, locking the high-pressure heat dome in place. This explains why droughts and heatwaves are so often intertwined and mutually reinforcing.
The complexity of these interactions makes them difficult to model with precision. The feedback from clouds, for example, is one of the largest sources of uncertainty in climate projections. Depending on their type and altitude, clouds can have either a cooling or a warming effect, and their response to a warmer world is not fully understood. This uncertainty highlights the challenge for insurers trying to project future agricultural losses or heat-related health crises, as local conditions can create non-linear spikes in severity far beyond what a simple global temperature rise would suggest.
The Modeling Mistake of Assuming Climate Change Will Remain Gradual
The single greatest error in conventional climate risk modeling is the implicit assumption of linearity. Models often project impacts by drawing a straight or gently curving line from the present into the future. This approach completely fails to capture the reality of a system dominated by feedback loops, where change is more likely to be characterized by periods of relative stability punctuated by abrupt, radical shifts. The concept of “compounding disturbances” is key here; it’s not just one stressor, but the interaction of multiple stressors (e.g., drought, heat, and fire) that pushes a system over a tipping point.
The Amazon rainforest serves as a stark case study. It’s not just warming, or just deforestation, but the combined effect that creates systemic fragility. One recent study reveals that by 2050, 10-47% of the Amazon forest will be exposed to these compounding disturbances, pushing it toward a large-scale tipping point. The enormous range in that projection (10% to 47%) is, in itself, a crucial piece of data: it is a quantified measure of our uncertainty. It tells modelers that predicting a single outcome is a fool’s errand; the focus must shift to understanding the boundaries of possibility and the triggers for a state shift.
This non-linear reality invalidates risk models that simply extrapolate from past data. An insurer modeling wildfire risk based on 20th-century statistics is unprepared for a world where forest ecosystems can collapse into a more flammable state. For investors and insurers, the critical takeaway is that history is no longer a reliable guide. The system’s rules are changing, and risk models must evolve from simple extrapolation to the far more complex task of identifying and monitoring systemic fragility.
Action Plan: Auditing Your Risk Model for Non-Linear Tipping Points
- Identify Dependencies: Map all assets and liabilities that are directly or indirectly dependent on stable climate systems (e.g., agriculture, coastal real estate, supply chains).
- Isolate Feedback Loop Exposure: For each dependency, identify the key feedback loops that could cause a non-linear shift (e.g., ice-albedo for shipping routes, soil moisture for crop yields).
- Stress-Test for State Shifts: Instead of modeling gradual change, run scenarios that assume a critical threshold has been crossed (e.g., “What if the Amazon becomes a carbon source tomorrow?”).
- Monitor Early Warning Signals: Move beyond lagging economic data and incorporate real-time physical indicators of system resilience (e.g., Arctic sea ice extent, Amazon dry season length).
- Quantify Model Uncertainty: Explicitly state the range of uncertainty from feedback loops in all long-term projections, replacing single-point forecasts with probability distributions of multiple plausible futures.
How to Intervene in Local Feedback Loops to Prevent Desertification?
While many feedback loops are daunting in scale, they also present opportunities for targeted intervention. Because these systems are self-reinforcing, a well-placed intervention can also become self-reinforcing, creating a “positive” positive feedback loop toward ecosystem restoration. Preventing desertification is a prime example. The process is a classic feedback spiral: loss of vegetation leads to exposed, dry soil, which reflects more heat and retains less water, making it harder for new vegetation to grow.

Interventions aim to break this cycle. Techniques such as building “half-moon” micro-catchments to trap rainwater, reintroducing native, drought-resistant vegetation, and fostering the growth of biological soil crusts can reverse the process. Once a small amount of vegetation takes hold, it provides shade, attracts moisture, and contributes organic matter to the soil. This makes the local environment more hospitable, allowing more plants to grow and creating a virtuous cycle of restoration. These local interventions are crucial, but they exist within the context of global constraints. Studies show that for large ecosystems like the Amazon, there are critical rainfall and temperature thresholds that, if crossed on a macro level, could render local efforts ineffective. For instance, one study recommends setting a safe boundary at 1.5°C above preindustrial levels to preserve the Amazon system.
This duality is key for risk analysis. It shows that while macro-level climate stability is paramount, targeted local actions can significantly increase resilience and stave off regional tipping points. For an insurer or investor, this means risk and opportunity are two sides of the same coin. Regions demonstrating successful implementation of these restoration feedback loops may represent more stable, long-term investments, while those ignoring them are on an accelerated path to systemic breakdown.
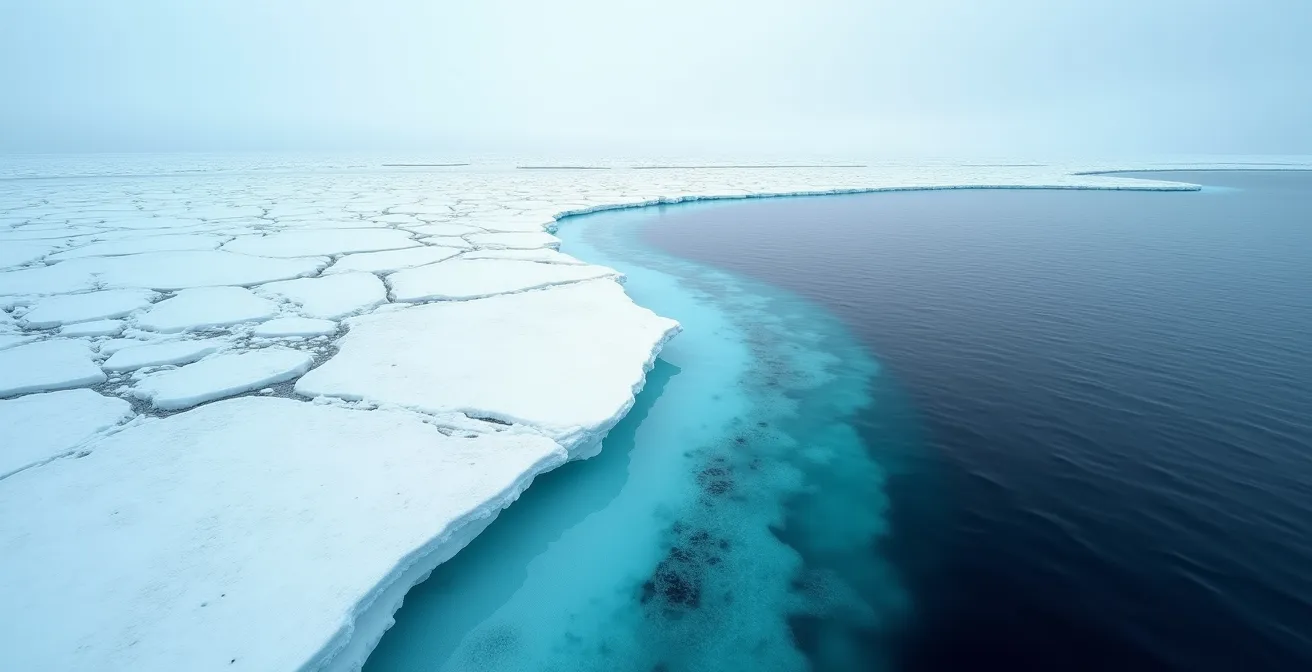
Why Does White Ice Reflect 80% of Sunlight While Dark Ocean Absorbs It?
The dramatic difference in reflectivity between ice and open ocean is the engine of one of the most well-known and powerful positive feedback loops: the ice-albedo effect. The term “albedo” refers to the fraction of solar radiation reflected by a surface. Fresh, bright white snow and ice have a very high albedo, reflecting up to 90% of the sun’s energy back into space. In stark contrast, the dark blue surface of the open ocean has a very low albedo, absorbing more than 90% of that same energy. This simple physical property has profound consequences for the global climate system.
As the climate warms, sea ice melts, exposing the darker ocean water underneath. This newly exposed dark surface absorbs more solar energy, which in turn warms the water further. This warmer water then melts even more ice, both from below and at the edges, exposing more dark ocean and creating a self-reinforcing cycle of warming and melting. This is not a theoretical concept; it is a primary reason why the Arctic is warming at a dramatically accelerated rate.
The table below, drawing on NASA data, starkly illustrates the physics at play. Even small changes, like the formation of darker melt ponds on the surface of ice sheets, can significantly reduce the local albedo and accelerate the feedback loop. This mechanism is a perfect example of a non-linear process. The rate of warming isn’t just proportional to the initial temperature increase; it is accelerated by the physical changes that warming causes.
This comparative data, based on an analysis from NASA, quantifies the core driver of the ice-albedo feedback loop.
| Surface Type | Albedo Value | Solar Reflection % |
|---|---|---|
| Fresh Snow | ~0.9 | 90% |
| Sea Ice | 0.5-0.7 | 50-70% |
| Open Ocean | <0.1 | <10% |
| Melt Ponds | 0.2-0.4 | 20-40% |
Why Does Melting Arctic Ice Accelerate Global Warming by 25%?
The statement that melting Arctic ice accelerates global warming by a specific figure like 25% is a simplification, but it points to a collection of powerful, interconnected feedback loops centered in the polar regions. The primary mechanism is Arctic Amplification, where the ice-albedo effect causes the Arctic to warm significantly faster than the rest of the planet. Data shows that Arctic amplification shows the region warming 2-4 times faster than the global average. This disproportionate warming is the trigger for other, even more dangerous feedback loops.
Chief among these is the thawing of Arctic permafrost. Permafrost is permanently frozen ground that contains vast amounts of trapped organic carbon. As the Arctic warms, this ground thaws, and microbes begin to decompose the organic matter, releasing carbon dioxide and, more potently, methane. Methane is a greenhouse gas over 80 times more powerful than CO2 over a 20-year period. The scale of this potential carbon bomb is staggering. While the atmosphere currently contains about 5 gigatons of methane, scientists estimate there are hundreds of gigatons locked in the Arctic permafrost.
This creates the potential for a massive, non-linear surge in greenhouse gas concentrations that is not accounted for in many gradual-change climate models. The release of this methane would drastically accelerate global warming, which would in turn thaw more permafrost, releasing even more methane. This is the definition of a runaway feedback loop and represents one of the greatest sources of systemic fragility in the global climate system. It is a low-probability, high-impact event that standard risk modeling struggles to price, yet its potential consequences are civilization-threatening.
Key takeaways
- Feedback loops are amplifiers, not drivers; they multiply the effect of initial CO2-driven warming, often non-linearly.
- Local tipping points, like a rainforest becoming a carbon source, can have sudden and cascading global consequences that defy gradual models.
- Effective risk management must evolve from predicting a single future to assessing systemic fragility and the potential for abrupt state shifts.
How Systemic Disruption in Ocean Currents Changes Weather Patterns in Europe?
The intricate system of global ocean currents, particularly the Atlantic Meridional Overturning Circulation (AMOC), acts as a planetary heat-distribution network. The AMOC brings warm, salty water north, releasing heat into the atmosphere that gives Western Europe its relatively mild climate. However, this vast system is showing signs of slowing down, a prime example of systemic disruption with far-reaching, non-linear consequences. The slowdown is driven by another feedback loop: melting ice from Greenland is pouring vast amounts of cold, fresh water into the North Atlantic. This fresh water is less dense than the salty water, so it doesn’t sink as readily, disrupting the “overturning” engine of the current.
A significant slowdown or collapse of the AMOC would not be a gradual event felt evenly. It would be a radical state shift. It could lead to more severe winters and cooler overall temperatures in the UK and Scandinavia, while simultaneously causing accelerated sea-level rise along the U.S. East Coast and more intense heat and drought in the Sahel region of Africa. It would fundamentally scramble weather patterns, rendering historical data for agriculture, energy demand, and insurance obsolete. The effects are interconnected and unpredictable; as one expert notes, we are entering a period where “forest loss becomes self-reinforced,” a principle that applies equally to the ocean’s systemic stability.
This potential disruption highlights the ultimate challenge for risk modelers. It is a high-impact event whose probability is deeply uncertain but increasing. It’s a “known unknown” of colossal proportions. The stability of European weather, a cornerstone of economic planning for centuries, is dependent on a system being actively disrupted thousands of miles away. This teleconnection is the essence of systemic risk, where a seemingly distant problem (Greenland ice melt) can trigger a catastrophic and abrupt failure in a completely different part of the global system. Preparing for this requires a radical shift in thinking, from predicting the weather to modeling the stability of the systems that create it.
For investors and insurers, the only rational response is to fundamentally re-evaluate the tools of the trade. Your models must evolve from linear extrapolation to non-linear scenario analysis. The critical task is no longer to predict the future, but to stress-test your portfolios and policies against a range of plausible, abrupt, and systemic state shifts.